 Geus Geonetworks metadata catalogue
Type of resources
Available actions
Topics
Keywords
Contact for the resource
Provided by
Years
Formats
Representation types
Update frequencies
status
Scale
Resolution
-
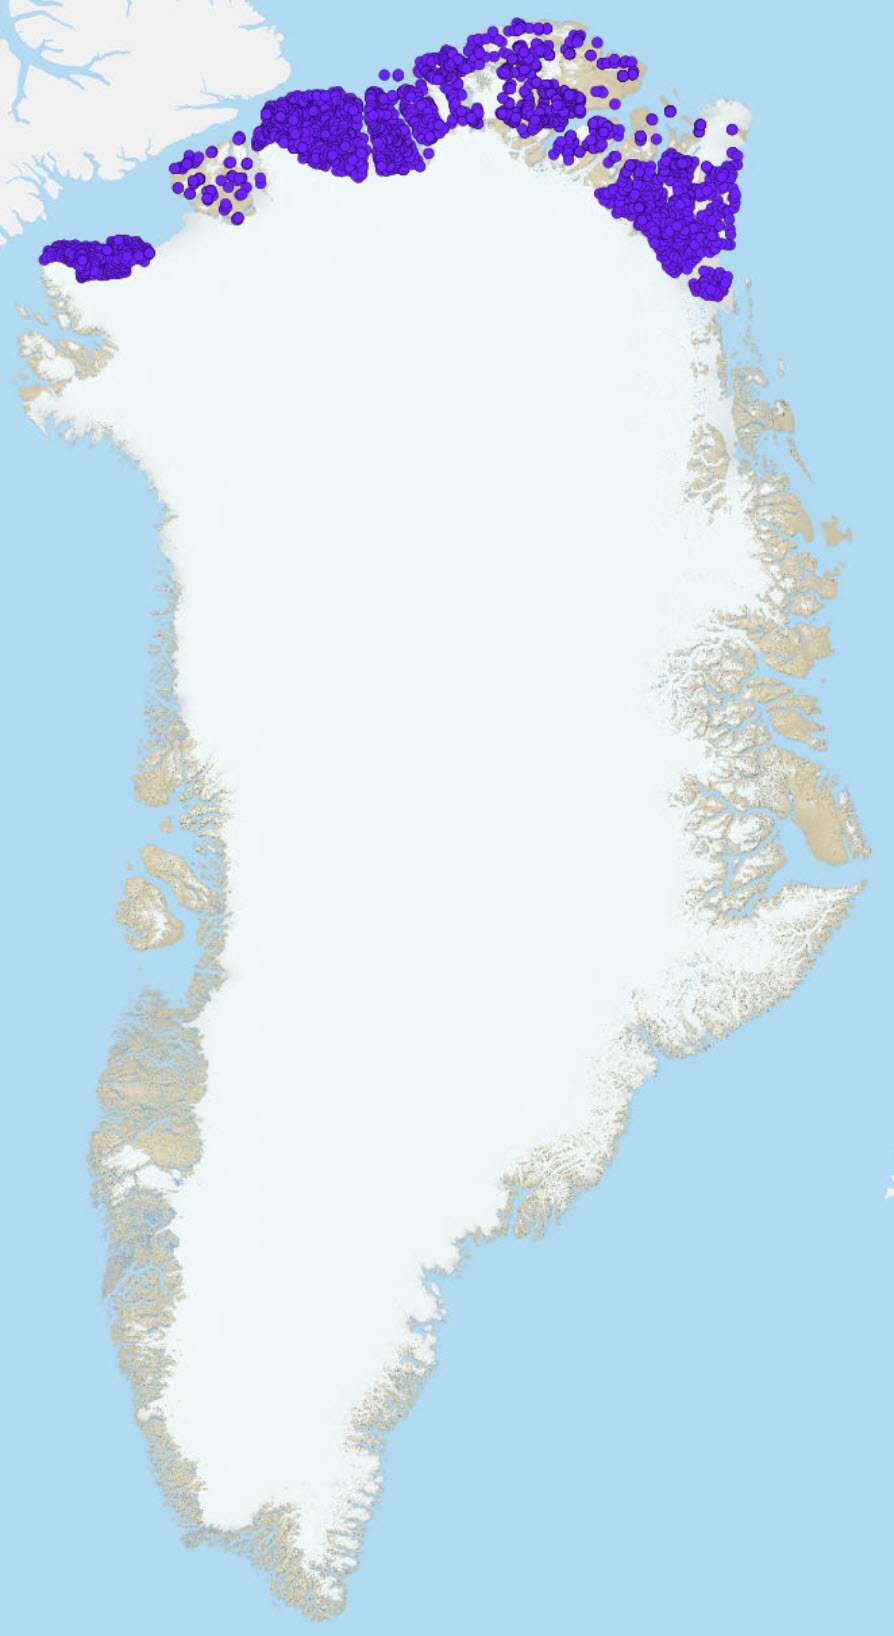
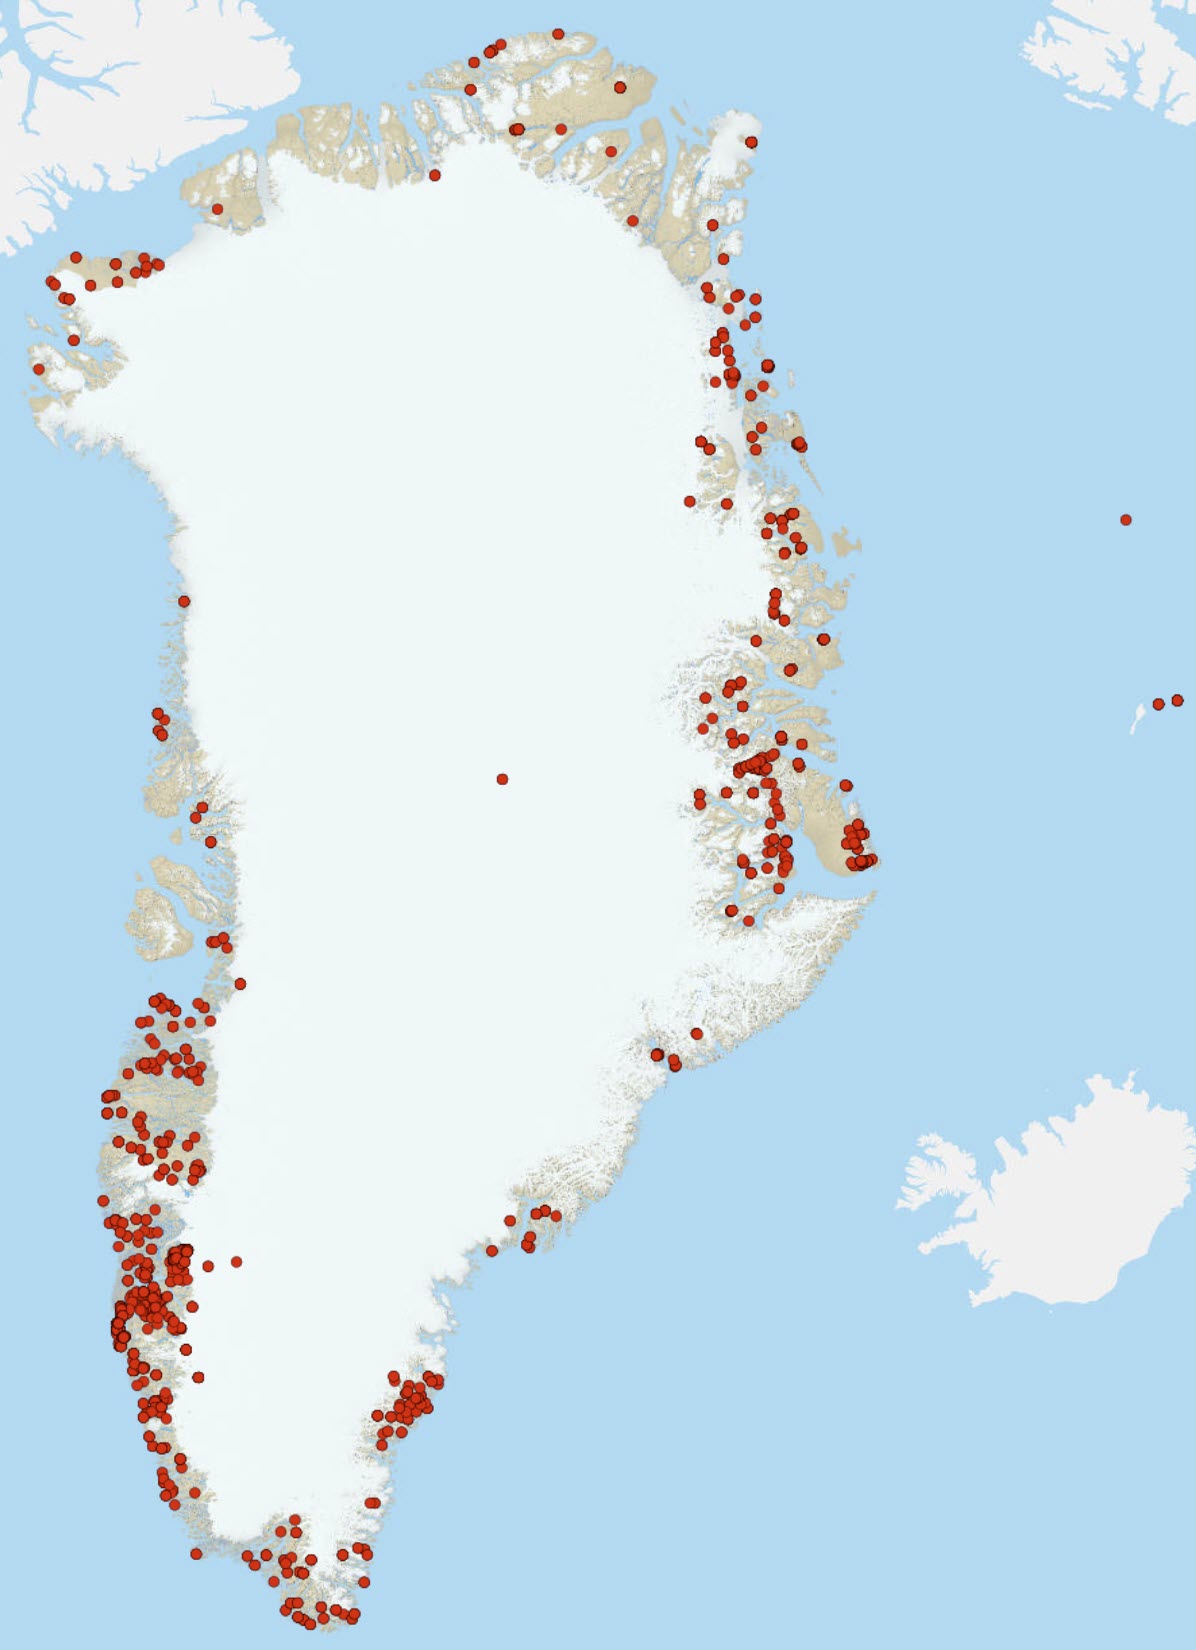
This view presents data selected from the geochemical mapping of North Greenland that are relevant for an evaluation of the potential for zinc mineralisation: CaO, K2O, Ba, Cu, Sr, Zn. The data represent the most reliable analytical values from 2469 stream sediment and 204 soil samples collected and analysed over a period from 1978 to 1999 plus a large number of reanalyses in 2011. The compiled data have been quality controlled and calibrated to eliminate bias between methods and time of analysis as described in Thrane et al., 2011. In the present dataset, all values below lower detection limit are indicated by the digit 0. Sampling The regional geochemical surveys undertaken in North Greenland follows the procedure for stream sediment sampling given in Steenfelt, 1999. Thrane et al., 2011 give more information on sampling campaigns in the area. The sample consists of 500 g sediment collected into paper bags from stream bed and banks, alternatively soil from areas devoid of streams. The sampling density is not consistent throughout the covered area and varies from regular with 1 sample per 30 to 50 km2 to scarce and irregular in other areas. Analyses were made on screened < 0.1 mm or <0.075 mm grain size fractions.
-
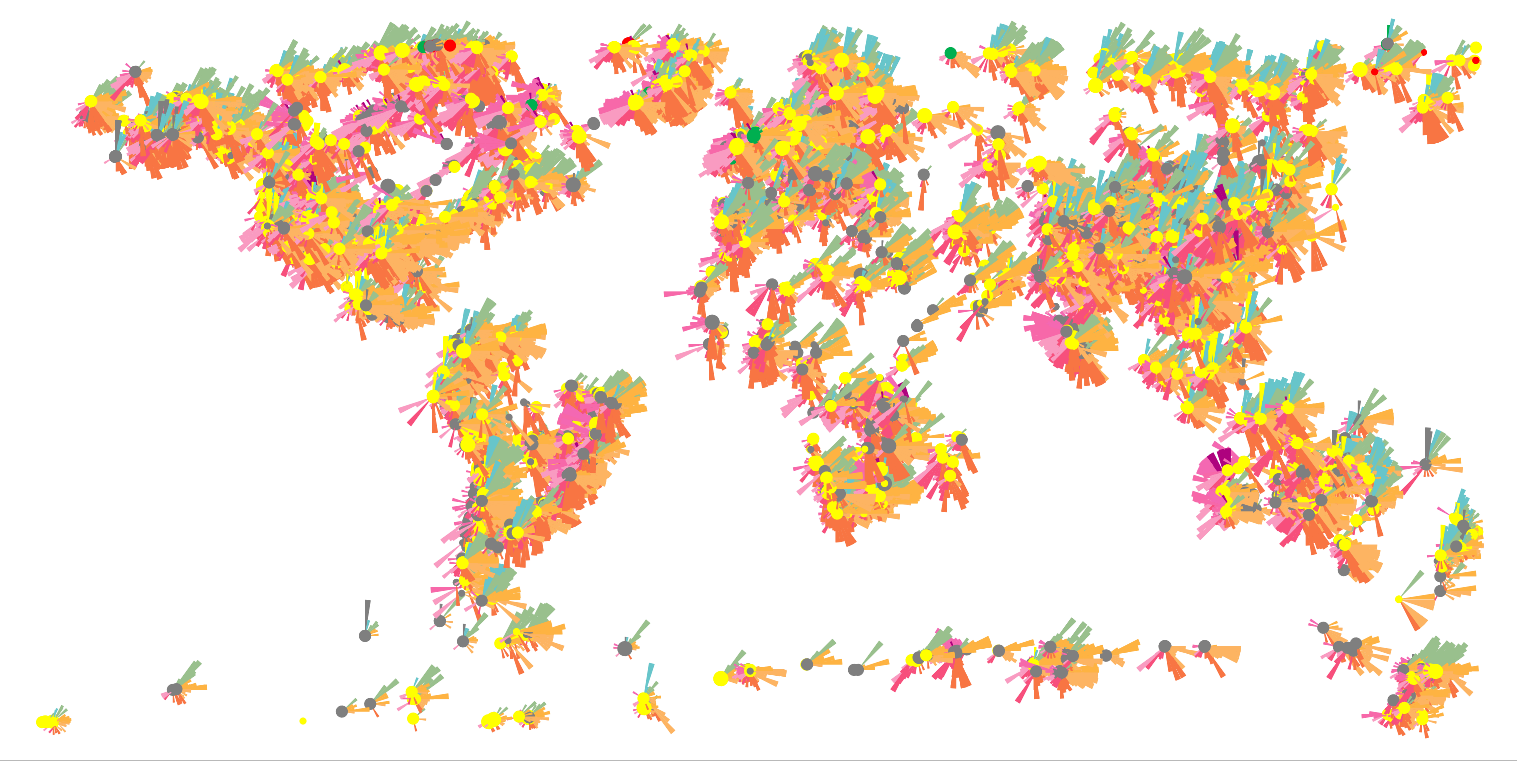
Zircon age data as gathered from literature and GEUS samples
-
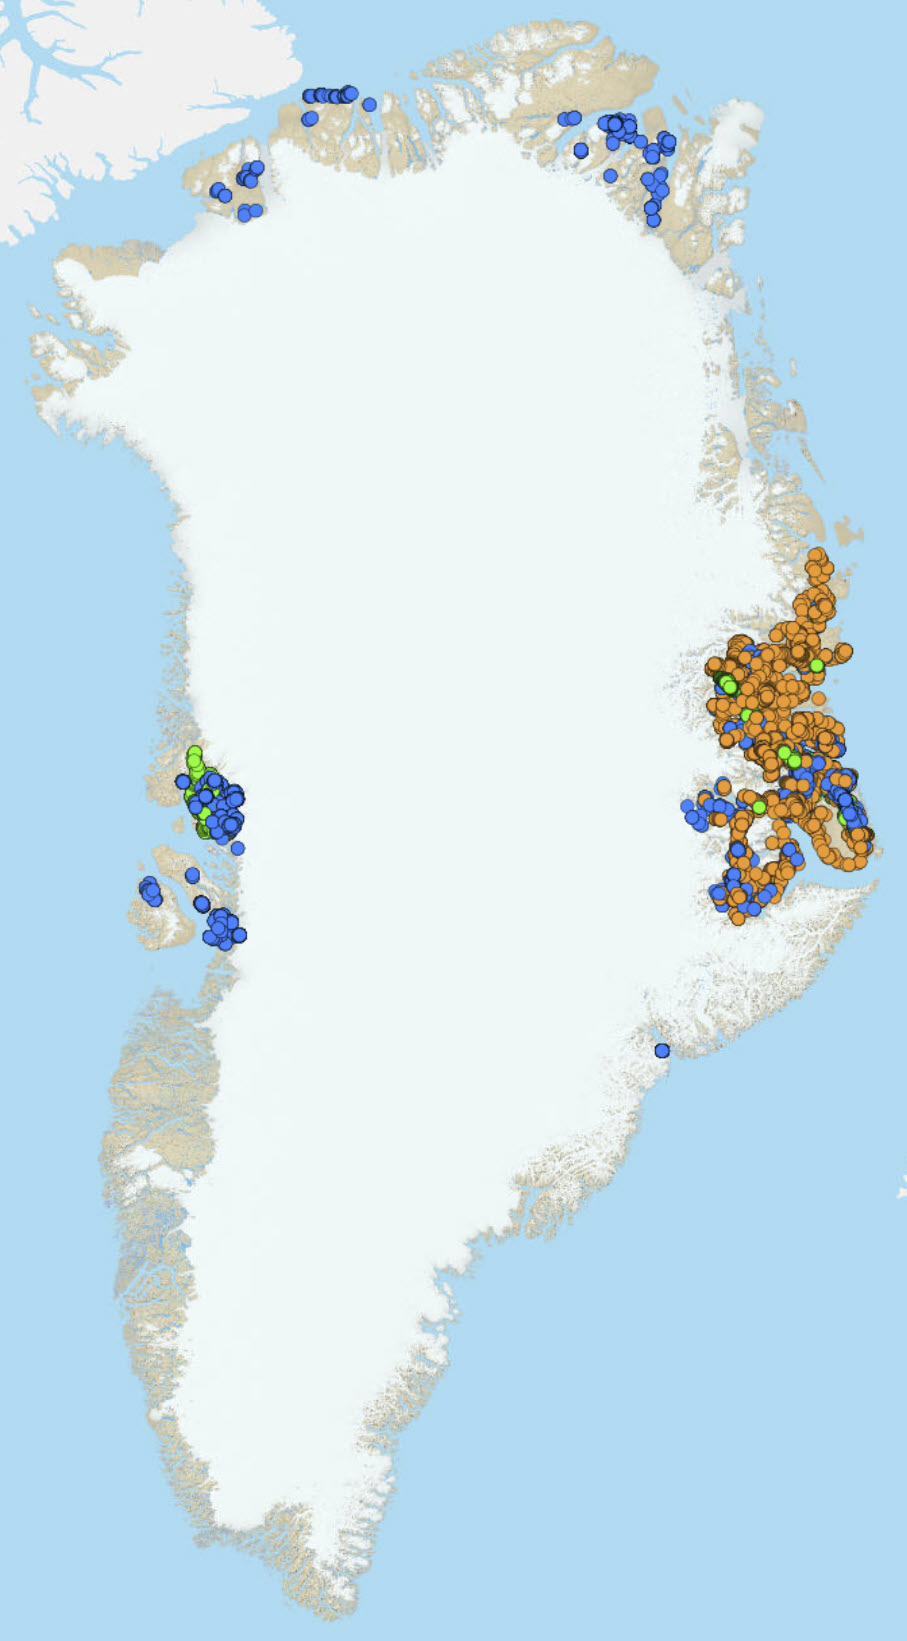
Exploration companies are obliged to report their activities to the Ministry of Minerals and Resources (MMR). Now reports are delivered in digital format, but were previously delivered in paper, to the Geological Survey of Denmark and Greenland (GEUS). They are scanned and released reports are available under Reports. Digital restoration The data that the reports hold is thus available, but stored as images in scanned pdf?s. The geochemical data of 4 reports (Allen & Harris, 1980; Coppard et al., 1992; Harris et al., 1992 and Pearson & Joudrie, 1995) have been digitized. I.e. the reports have be optically characterised and the sample locations georeferenced. The matching of the sample locations and geochemically referenced samples does not always match. Meaning that a sample that has coordinate may not have geochemical results, and a sample with geochemical measurements might not have coordinate. The reporting of the analytical facilities and precision is sparse. Detection limits, analytical uncertainty and reliability are generally not reported. Analytical methods and analysed grain fractions of sediment samples also not reported. When all these issues have been listed, it should be noted that errors may occur. From the digital restoration of scanned paper to optically characterisation of the scanned text and numbers errors may be introduced. The user is cautioned to these issues. Upload to data base To make the data available on the web, upload to GEUS sample data base is required. To fit into the sample data base, some adjustments had to be made. Sample names modified, collector created etc., resulting in modified sample names, relative to the ones used in the reports. The reports from which the samples occur in are not mentioned in the data base. Hence the four reports and links to them are listed below:
-
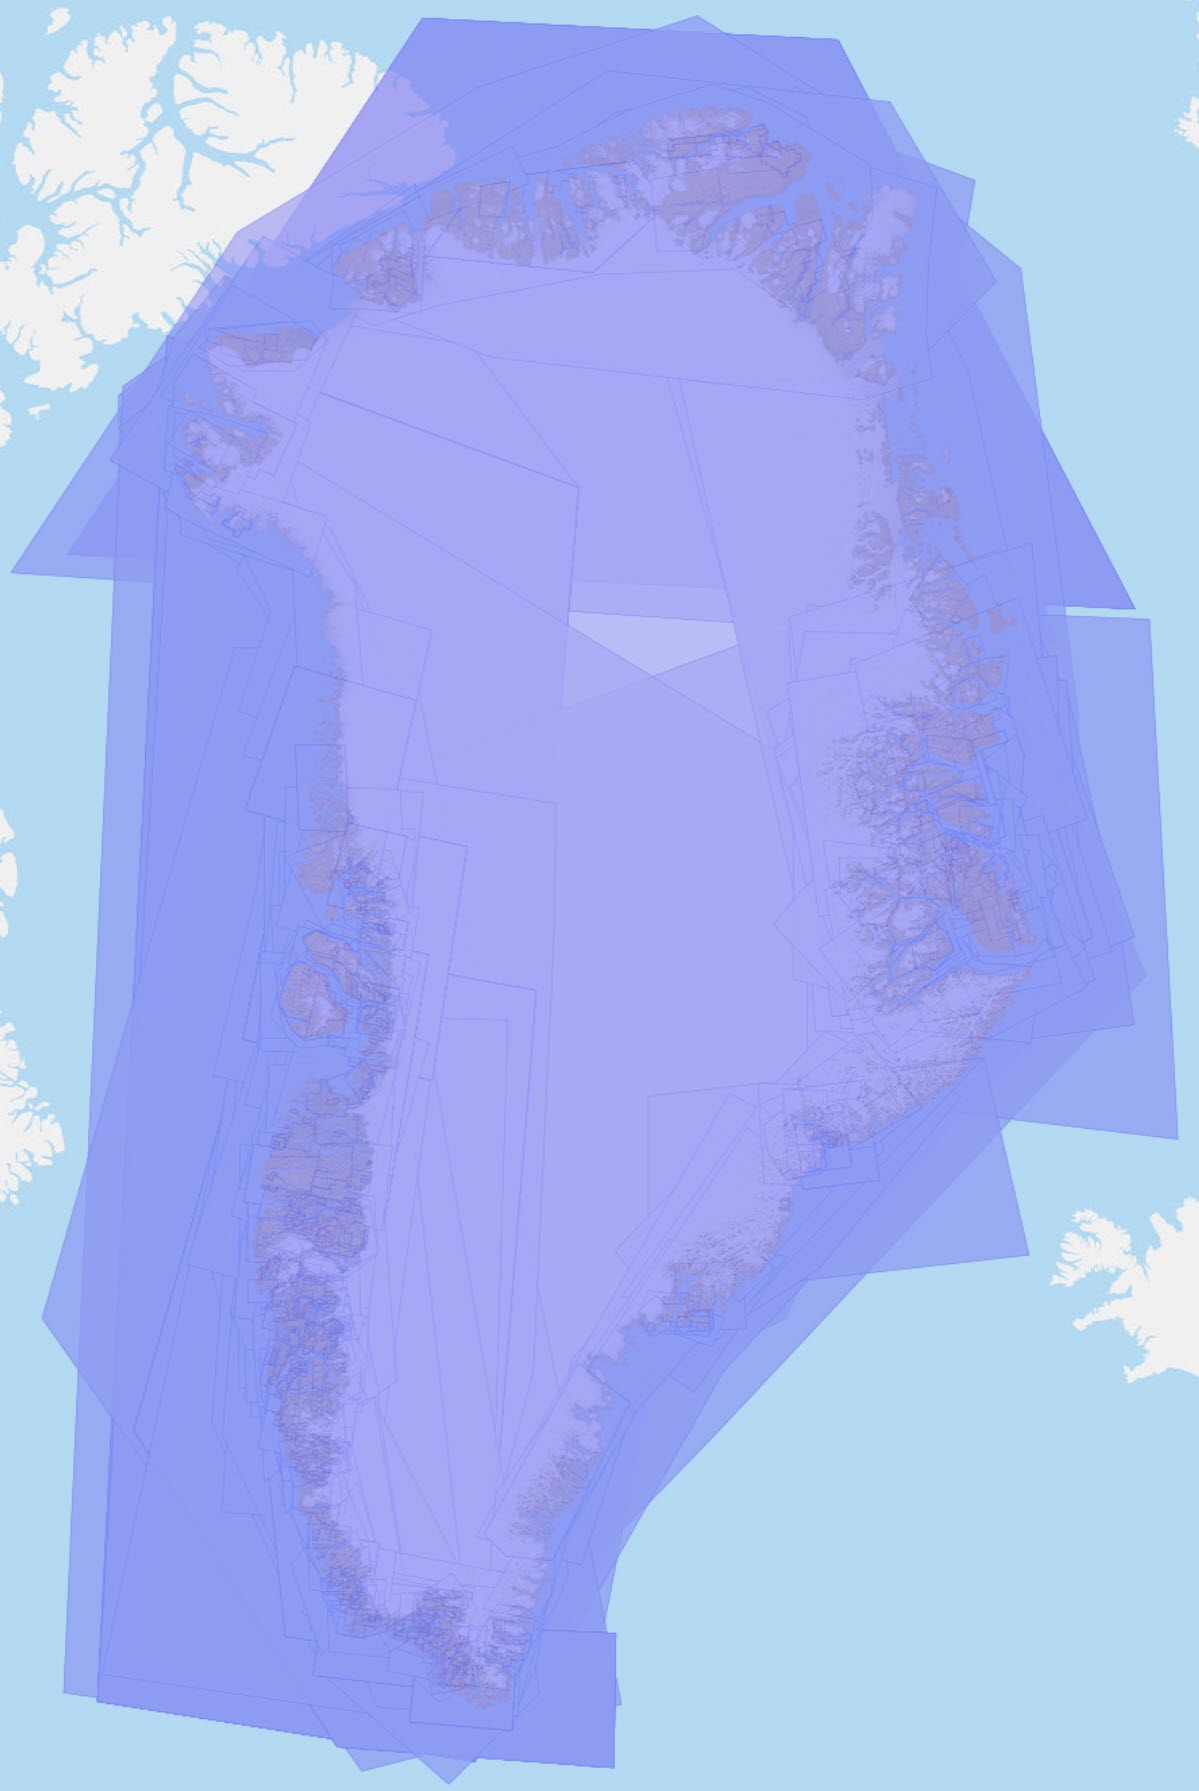
The geophysical data available on the Greenland Mineral Resources Portal are both released company data and data acquired based on public funding (AEM and Aeromag surveys). The AEM Greenland 1994-1998 project, encompassed high resolution detailed multi-parameter surveys (electromagnetic, magnetic and partly radiometric) in the years 1994, 1995, 1996, 1997, and 1998 survey 1 and survey 2 producing a total of 75 000 line kilometres. The Aeromag projects, encompassed high resolution magnetic surveys conducted in 1992, 1995, 1996, 1997, 1998, 1999, 2001, 2012 and 2013 producing a total of more than 550 000 line kilometres. The projects were financed by the governments of Greenland and Denmark. More detailed information on the available geophysical date is given in Geology and Ore No. 22.
-
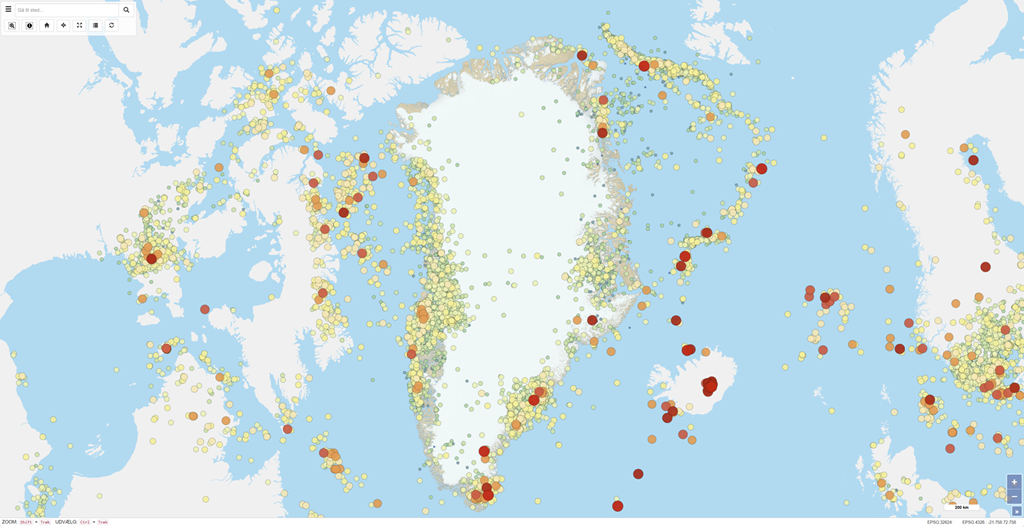
GEUS' Earthquake Portal provides information on all recorded earthquakes in Greenland. The data are extracted from GEUS' earthquake database and are updated daily. As a result, the timing, locations, and magnitudes of events may change as new data are added and existing events are revised. Continuous quality control is carried out, aiming to identify and remove explosions – typically related to military exercises or the removal of old munitions. Therefore, the list may change over time, and some uncertainty may be associated with the determination of epicentres and depths. The portal displays information for each earthquake, including the time of occurrence (year, month, day, hour, minute, second) in Greenwich Mean Time (GMT), the geographical location and depth of the epicentre, and the local magnitude measured on the Richter scale. Earthquake data can be exported from the portal according to the defined zoom level and map extent.
-

The digital terrain model of Greenland is constructed on the basis of GEUS's topographic datasets from the official geological maps of Greenland in scale ratio 1:100.000 and 1:500.000. The DEM is created using an interpolation method called Topo to Raster function in ArcGIS Desktop which is primarily supported by contour lines, coastlines and elevation points. The creation of the DEM was divided into in sub-areas based on the map sheet frames from the geological map of Greenland in 1:500.000 scale and assembled as a raster mosaic. The DEM was created with the spatial coordinate reference system WGS 1984 / UTM Zone 24N Complex with a resolution of a 100x100 meter grid. Based on the final DEM, a hillshade efect of the terrain has been constructed.
-
Non-confidential mineral exploration licence reports and other geoscientific reports have been recieved by Greenlandic authorities and subsequently send to GEUS in accordance with the Mineral Resources Act of Greenland (1 January 2010) and associated regulations. This dataset allows to search in the database using alphanumeric and geographic search criteria and to access report metadata. It is also possible to download the actual report as a PDF file.
-
The Greenland Geochronology database compiles published U-Pb geochronology from a wide range of literature sources and normalizes and recasts the data into consistent ratios and uncertainty levels; specifically all errors are given at the 1 sigma level. Importantly, this normalization provides coherence across the dataset. Additionally, ratios are verified against ages and have, if necessary, been corrected to ensure an internally consistent dataset. Systematic collation and assessment of geochronological data can be best achieved by means of a database which holds information within a structured and consistent framework which permits querying to extract relevant data and minimises difficulty in cross comparison of age information where different standards have been used.
-
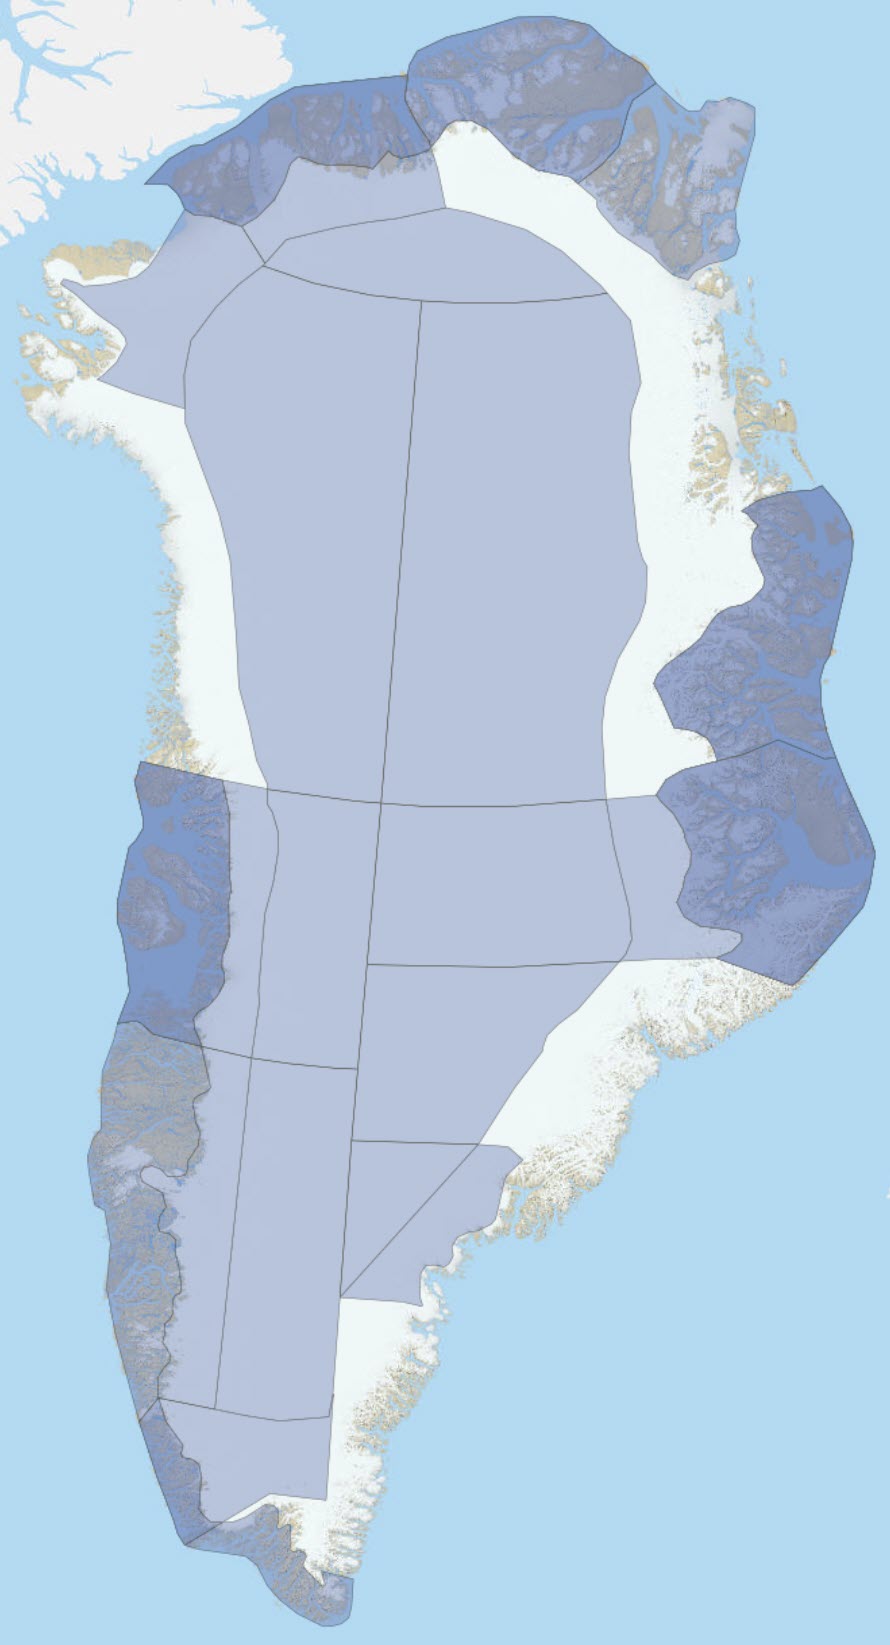
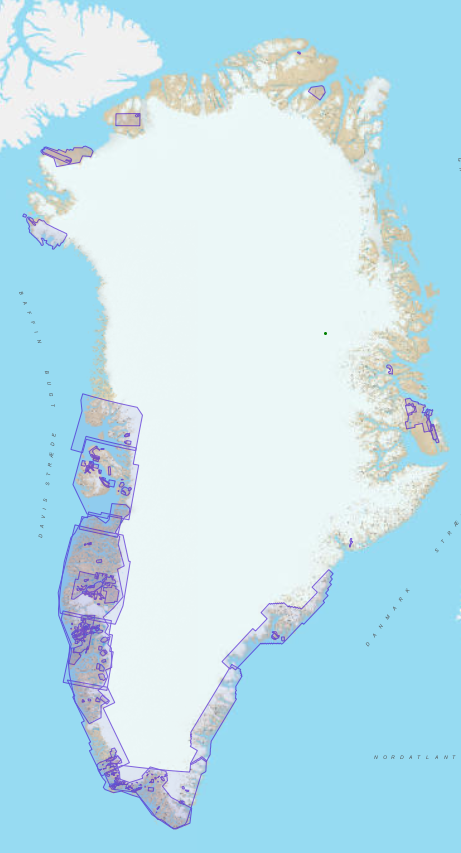
Dataset containing standard polygons for regions of Greenland and specific hand-drawn polygons representing the areas where the study was conducted that is described in the publication. Data can be filtered for publication title, authors, year of publication and the list of attributes contains other reference information including a link to the publication. The publications include GEUS Bulletin (2020 - ), Geological Survey of Denmark and Greenland Bulletin (2004 - 2019), Geology of Greenland Survey Bulletin (1997 - 2002), Bulletin Grønlands Geologiske Undersøgelse (1948 – 1996) , Danmarks og Grønlands Geologiske Undersøgelse Rapport, Rapport Grønlands Geologiske Undersøgelse (1964 – 1996), Open File Series Grønlands Geologiske Undersøgelse, Mima rapport, Grønlands Geologiske Undersøgelse Geological Map Descriptions and Geological Survey of Denmark and Greenland Map Series.
-
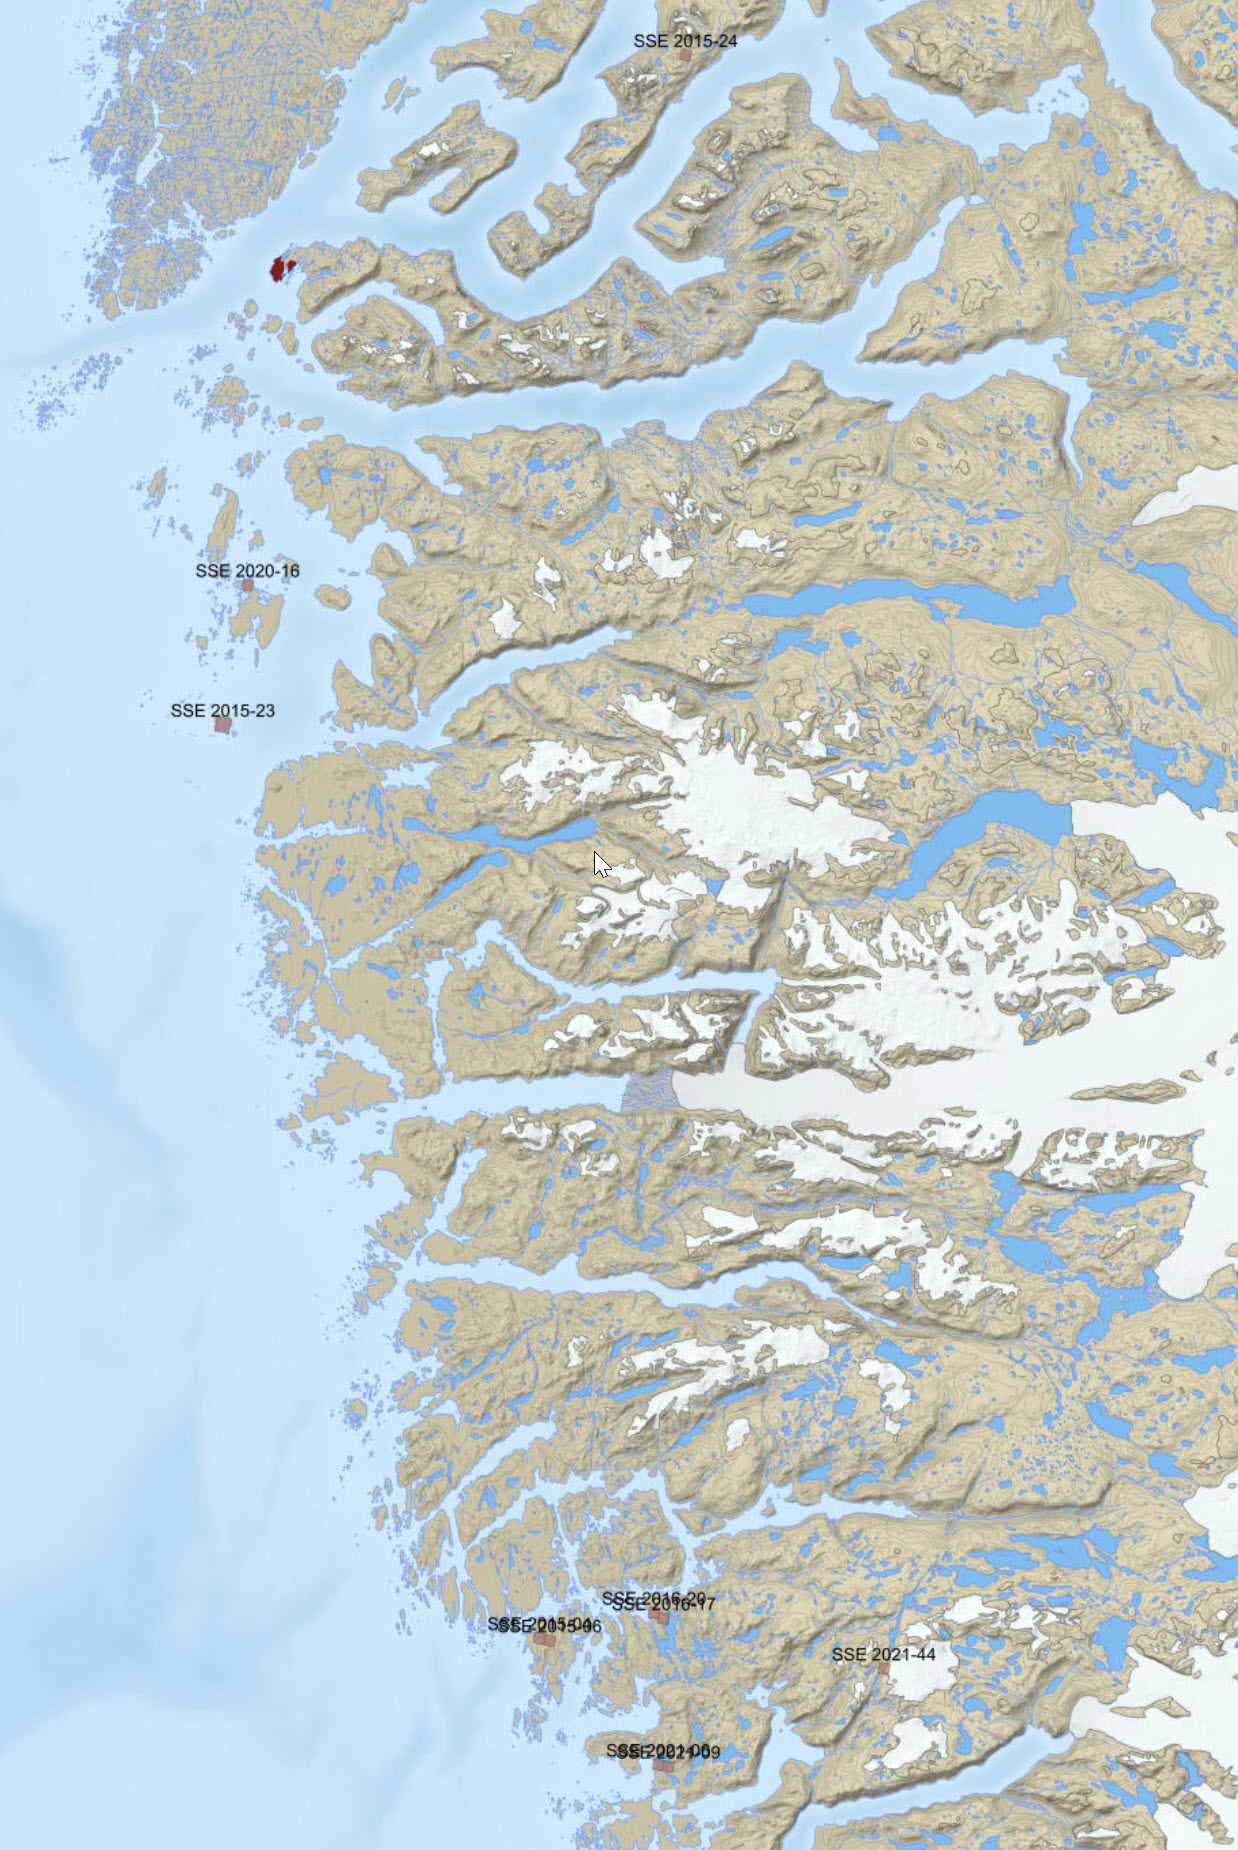
All active small scale licences. The data are converted from the WFS that th ministery of mineral resources (MMR) in Greenland provides. Links are provided in the online resources