 Geus Geonetworks metadata catalogue
Type of resources
Available actions
Topics
Keywords
Contact for the resource
Provided by
Years
Formats
Representation types
Update frequencies
status
Scale
Resolution
-
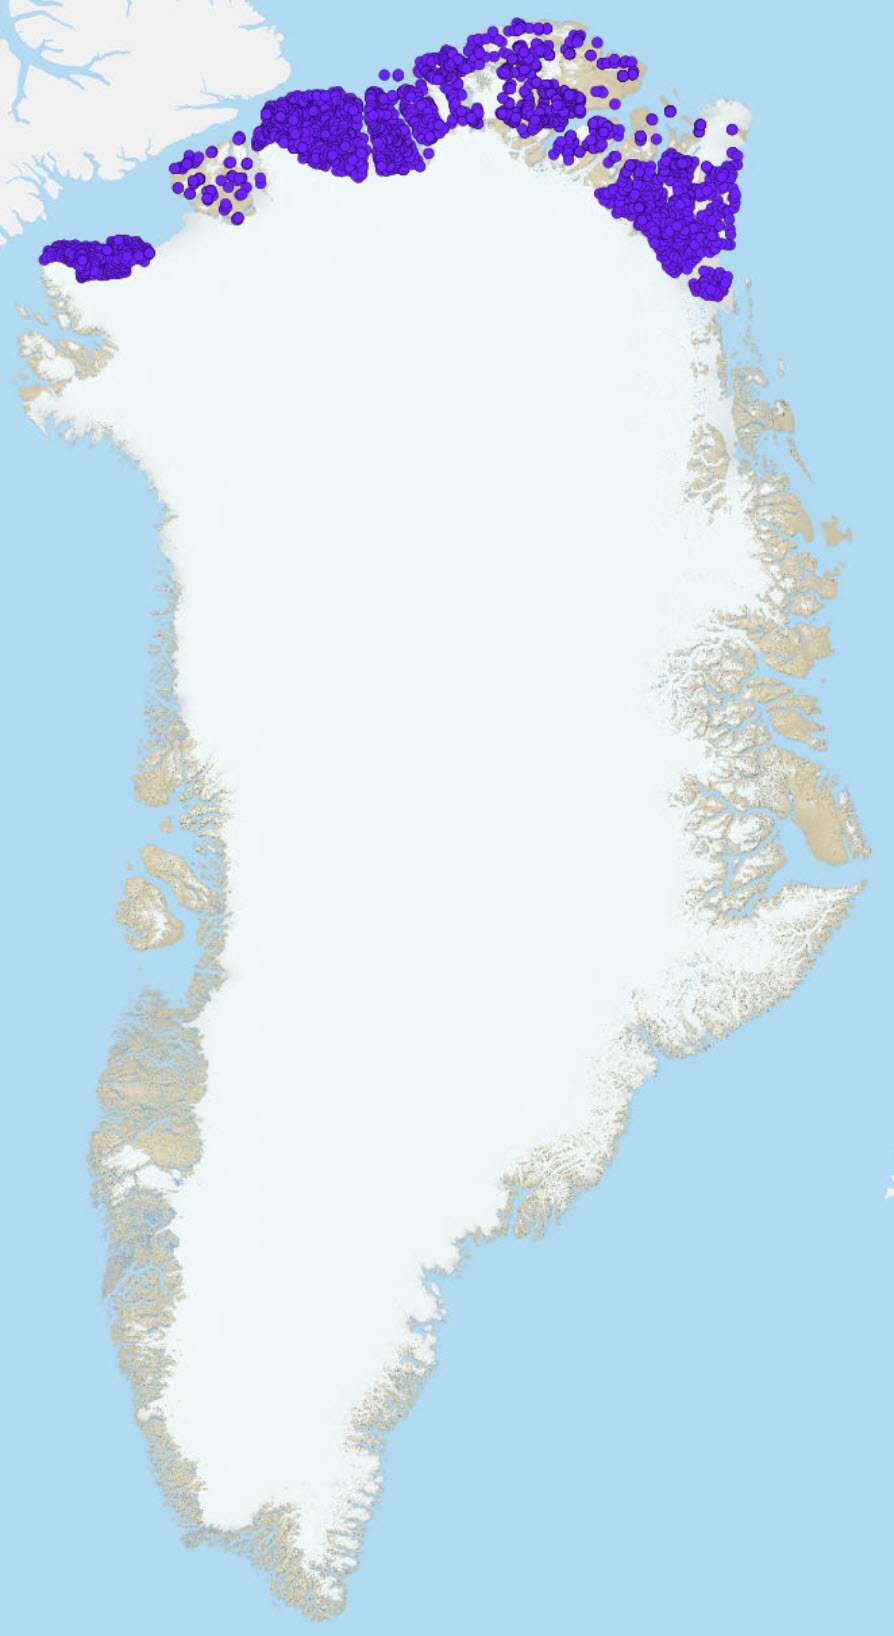
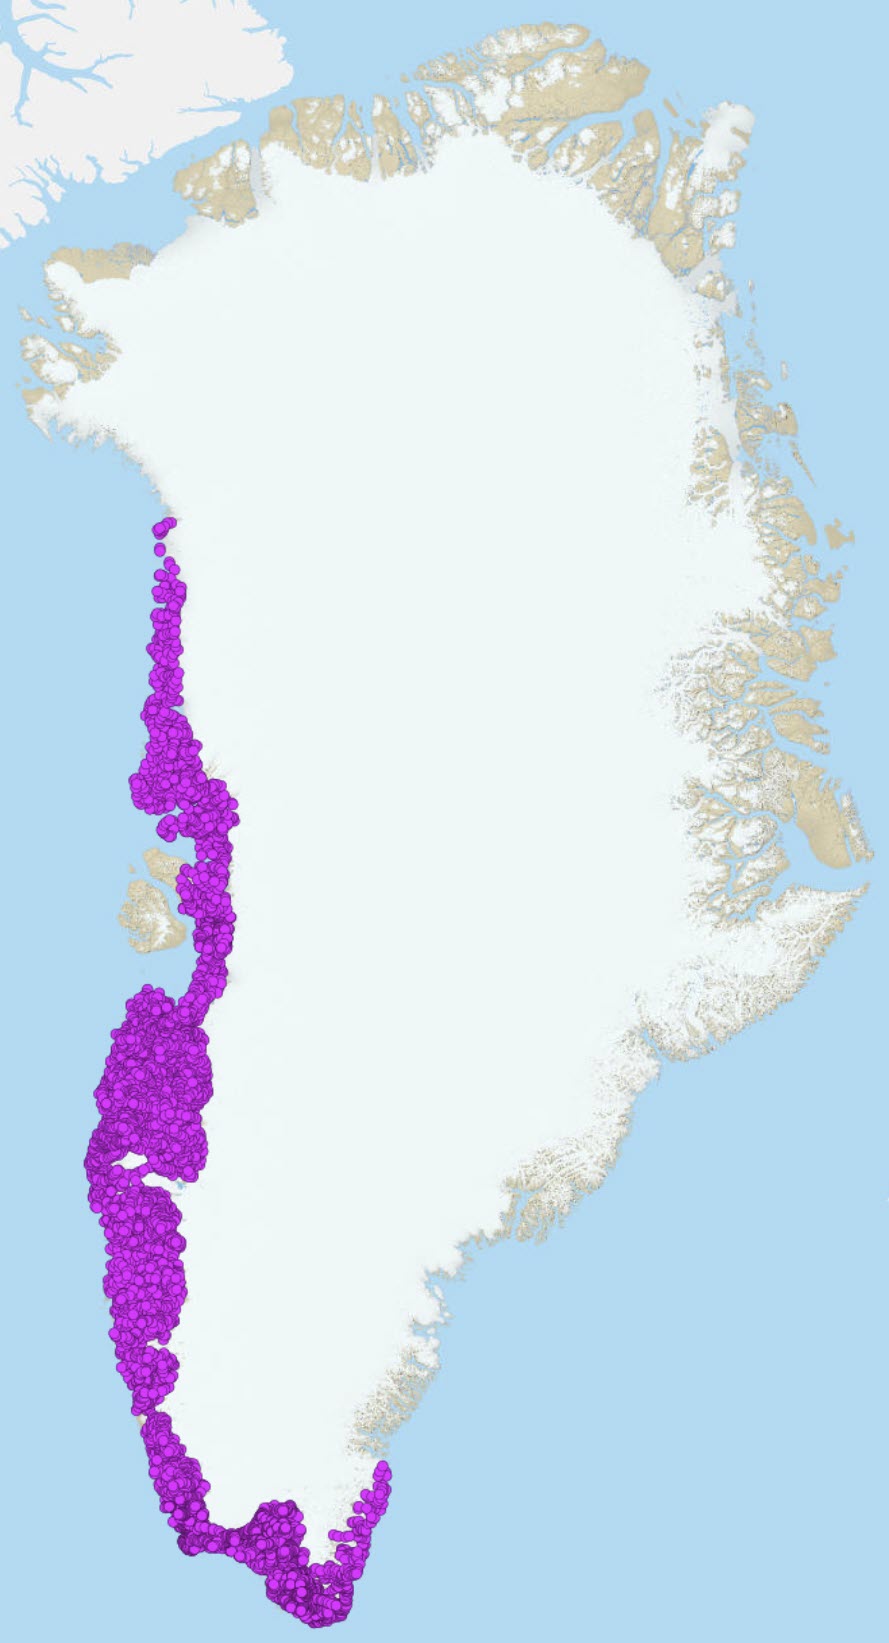
This view presents data selected from the geochemical mapping of North Greenland that are relevant for an evaluation of the potential for zinc mineralisation: CaO, K2O, Ba, Cu, Sr, Zn. The data represent the most reliable analytical values from 2469 stream sediment and 204 soil samples collected and analysed over a period from 1978 to 1999 plus a large number of reanalyses in 2011. The compiled data have been quality controlled and calibrated to eliminate bias between methods and time of analysis as described in Thrane et al., 2011. In the present dataset, all values below lower detection limit are indicated by the digit 0. Sampling The regional geochemical surveys undertaken in North Greenland follows the procedure for stream sediment sampling given in Steenfelt, 1999. Thrane et al., 2011 give more information on sampling campaigns in the area. The sample consists of 500 g sediment collected into paper bags from stream bed and banks, alternatively soil from areas devoid of streams. The sampling density is not consistent throughout the covered area and varies from regular with 1 sample per 30 to 50 km2 to scarce and irregular in other areas. Analyses were made on screened < 0.1 mm or <0.075 mm grain size fractions.
-
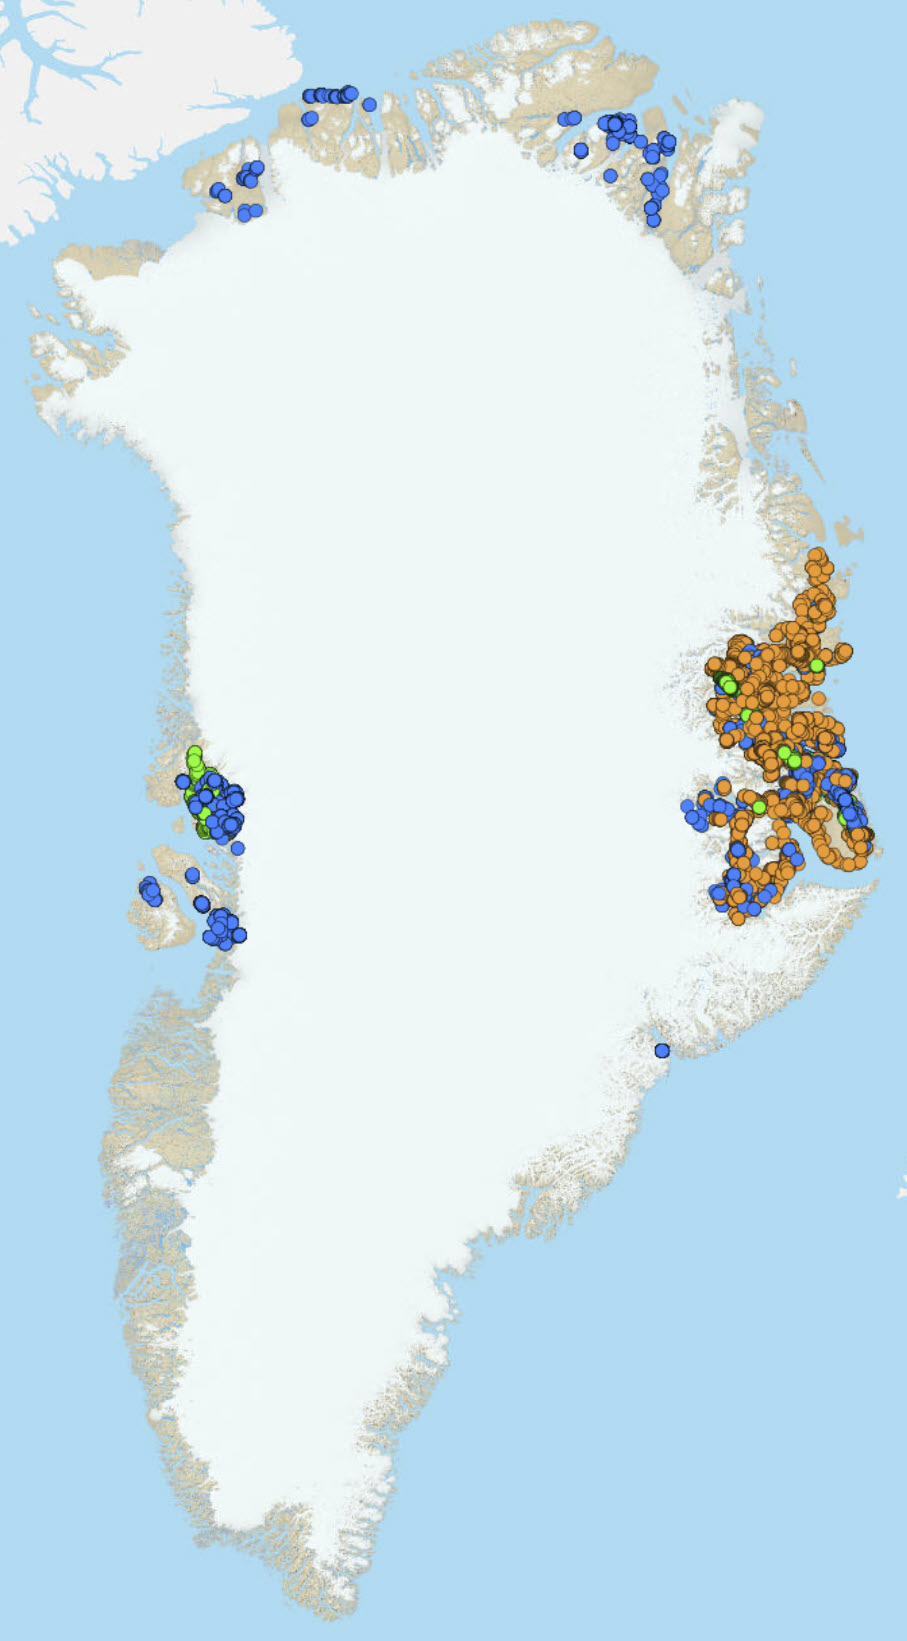
Exploration companies are obliged to report their activities to the Ministry of Minerals and Resources (MMR). Now reports are delivered in digital format, but were previously delivered in paper, to the Geological Survey of Denmark and Greenland (GEUS). They are scanned and released reports are available under Reports. Digital restoration The data that the reports hold is thus available, but stored as images in scanned pdf?s. The geochemical data of 4 reports (Allen & Harris, 1980; Coppard et al., 1992; Harris et al., 1992 and Pearson & Joudrie, 1995) have been digitized. I.e. the reports have be optically characterised and the sample locations georeferenced. The matching of the sample locations and geochemically referenced samples does not always match. Meaning that a sample that has coordinate may not have geochemical results, and a sample with geochemical measurements might not have coordinate. The reporting of the analytical facilities and precision is sparse. Detection limits, analytical uncertainty and reliability are generally not reported. Analytical methods and analysed grain fractions of sediment samples also not reported. When all these issues have been listed, it should be noted that errors may occur. From the digital restoration of scanned paper to optically characterisation of the scanned text and numbers errors may be introduced. The user is cautioned to these issues. Upload to data base To make the data available on the web, upload to GEUS sample data base is required. To fit into the sample data base, some adjustments had to be made. Sample names modified, collector created etc., resulting in modified sample names, relative to the ones used in the reports. The reports from which the samples occur in are not mentioned in the data base. Hence the four reports and links to them are listed below:
-
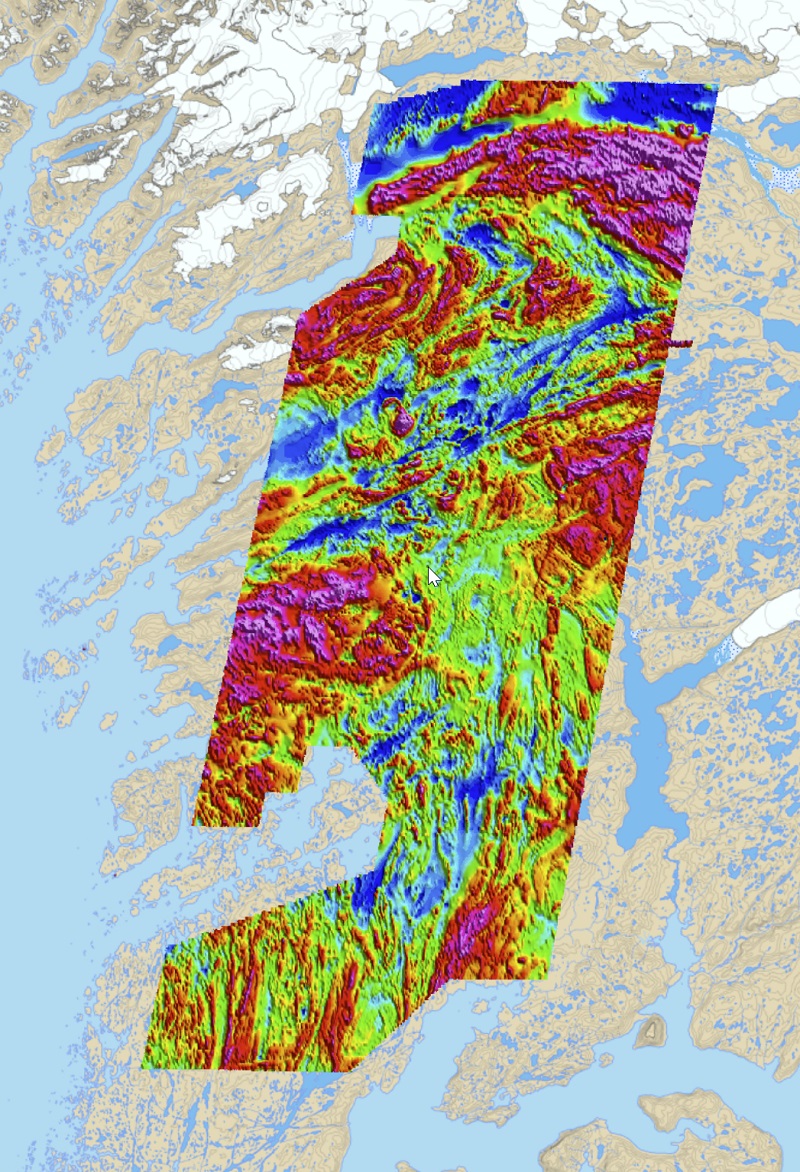
The AEM Greenland 19941998 are detailed surveys with combined electromagnetic and magnetic measurements that were carried out within a collaboration between GEUS/GGU and the Greenland Government in six selected areas of expected high mineral potential in Greenland. In total, 75 000 line km covering an area of 23 000 km² were measured in the project. Line spacing was 200 400 m (inline direction) and flight altitudes were typically around 120 m. With exception of one survey the collected electromagnetic data were time-domain data (GEOTEM system).
-
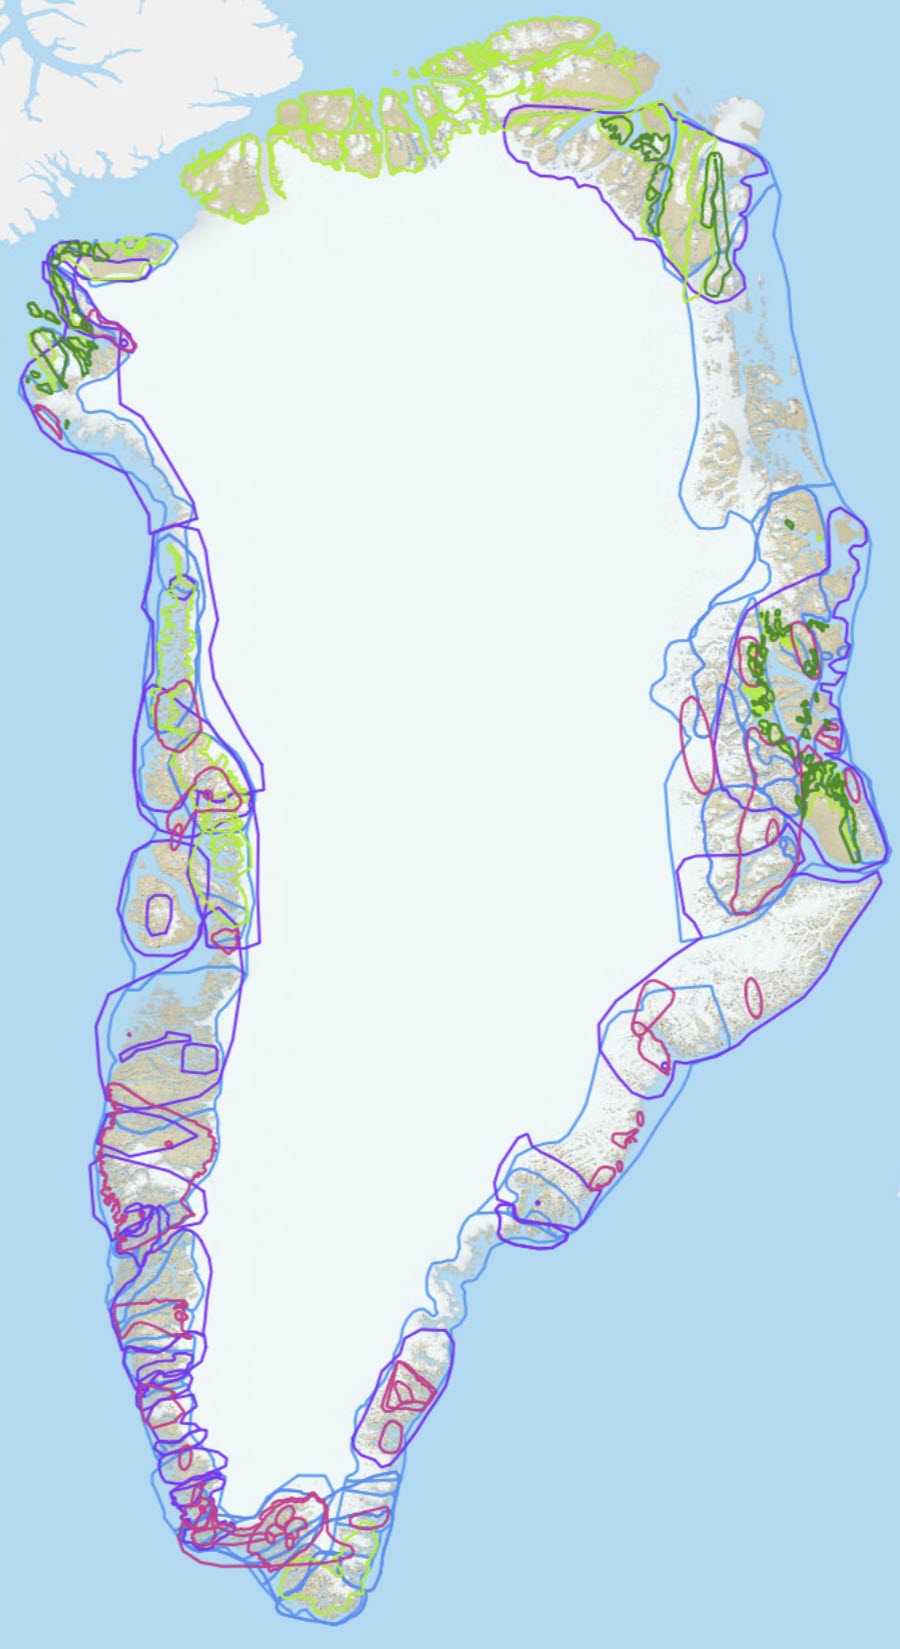
Greenland mineral assessment workshops have been held on Sedimentary-hosted Copper, type: redbed-, revett- and reduced-facies type in 2009, Various Rare Earth Elements deposit types in 2010 (this workshop was not carried out according to the 'three-part quantitative assessment' method), Sedimentary-hosted zinc SEDEX- and MVT-type in 2011, Magmatic nickel; komatiite-hosted, contact- and conduit-type in 2012 and Vein- and skarn type Tungsten in 2013 and Orogenic gold type in 2014. Most of the workshops, besides the one on rare earth elements, have been following the processes and methodologies used in the 'three-part quantitative assessment' method of the U.S. Geological Survey described by Singer (1993). The method does not define deposits or provide mineral resource or reserve estimates according to industrial or international recognised certified standards. The objective is to produce a probabilistic estimate of unknown/undiscovered deposits and corresponding probabilistic estimates of the total amount of metals down to one kilometre depth. The estimates do not take into account economic, technical, social or environmental factors. In the 'three-part quantitative assessment' method, an expert panel reviewed and discussed all available knowledge and data for a specific region (Tract) to assess the possibility of finding new undiscovered deposits within this Tract. The expert panels consisted of geologists from universities, research institutions, Surveys as well as private exploration and mining companies. The experts have either expertise in/worked with the deposit type in focus, with the regional and/or local geology relevant for the tracts being assessed or have expertise from exploration/mining projects for the deposit type in focus elsewhere in the world. One or two international top-experts on the mineral deposit type in focus for the different workshops have also participated in the workshop. After reviewing the available knowledge and data the members of the panel made their individual estimates (bids) of the number of undiscovered deposits they believed could be found under the best circumstances in a tract. The bids are based on the characteristics derived from descriptive mineral deposit models and a number of key-literature on the mineralisation type. In several of the workshops, critical elements have also been considered in the mineralising system (e.g. McCuaig & Hronsky 2014) associated with the deposit type in focus, when carrying out the bids. A panel discussion of the bids led to a consensus bid, which was used as input to a statistical Monte Carlo simulation. Based on established grade-/tonnage models of e.g. known tungsten deposits worldwide, this simulation can provide a prediction on how much undiscovered metals could be found within a Tract. The 'Tracts' are spatial polygons that define a certain area that was found to be permissive for the concerned mineral deposit type and which constitutes the same level of geology, knowledge and data coverage. Tracts are named with a unique name, tract area is given in square kilometre and consensus bids from team under N90, N50, N10, N05 and N01 headings of undiscovered metals deposits at different confidence levels. The statistics from the Monte Carlo simulation is shown under the headings Numbers of unknown deposits and Deposit density.
-
This view presents data from stream sediment geochemical mapping of West and South Greenland (Steenfelt, 2001a). Stream sediment samples were collected from 1979 to 1998 with as even coverage as possible from low-order streams and with a sampling density between 1 sample per 5 km2 and 1 sample per 50 km2, mostly around 1 sample per 30 km2. With few exceptions, the 0.1 mm grain size fractions of 500-g samples were analysed for major and trace elements by two or three methods. After careful quality control and elimination of bias between analytical values determined by different methods or at different times (calibration), the most reliable analytical data were selected as the final consistent dataset, containing data from 7122 samples analysed for up to 43 elements (see Steenfelt 1999, 2001b for details on data selection and calibration). Major element oxides and volatiles are determined by X-Ray Fluorescence Spectrometry (XRF) and loss on ignition, respectively. Loss on ignition mostly reflects the amount of organic material in stream sediment samples. As the aim is to show the regional variation in the chemistry of the minerogenic component of the stream sediment, volatiles are not included in the major element composition which is recalculated as volatile-free oxides. Instead, volatiles are listed in a separate column for documentation. Locally, high loss on ignition may be caused by high contents of carbonate in the stream sediment of streams draining rare occurrences of marble or carbonatites. For detailed or more accurate studies, the CO2 concentrations of the stream sediment samples should be measured, or the amount of carbonate minerals estimated by microscopy. Trace element data are from methods determining total concentrations (XRF, Instrumental Neutron Activation, Delayed Neutron Counting). The quality of the trace element data varies (see Steenfelt 1999, 2001b) In the present dataset, all values below lower detection limit are indicated by the digit 0. Sample location Before 1993, sample sites were originally marked on topographic maps at the scale 1:100,000 and their positions were later digitised and later again corrected, when a new topographic reference was introduced around year 2000. From 1993 onwards, GPS was used to determine sample positions.
-

The geological maps of Denmark on a scale of 1:400,000 focus on the Danish basin and its geological structures. The map includes areas that extend from the geological age 'Basis Kalk' and the Kalk Gruppen. The 'Basis Kalk' map shows the depth in metres, where 'Basis Kalk' denotes the area that forms the basis for all layers younger than the Early Cretaceous. Over the majority of the mapped area, this surface is level with the base of the Kalk Group, but where the limestone is eroded away, the surface is equal to the base of the Quaternary. The depth to 'Basis Kalk' is calculated as the depth to the base of the deposits younger than Denmark plus the thickness of the Kalk group. The map is published in DGU Map Series no. 29 from 1991, where further information about the mapping can be obtained.
-
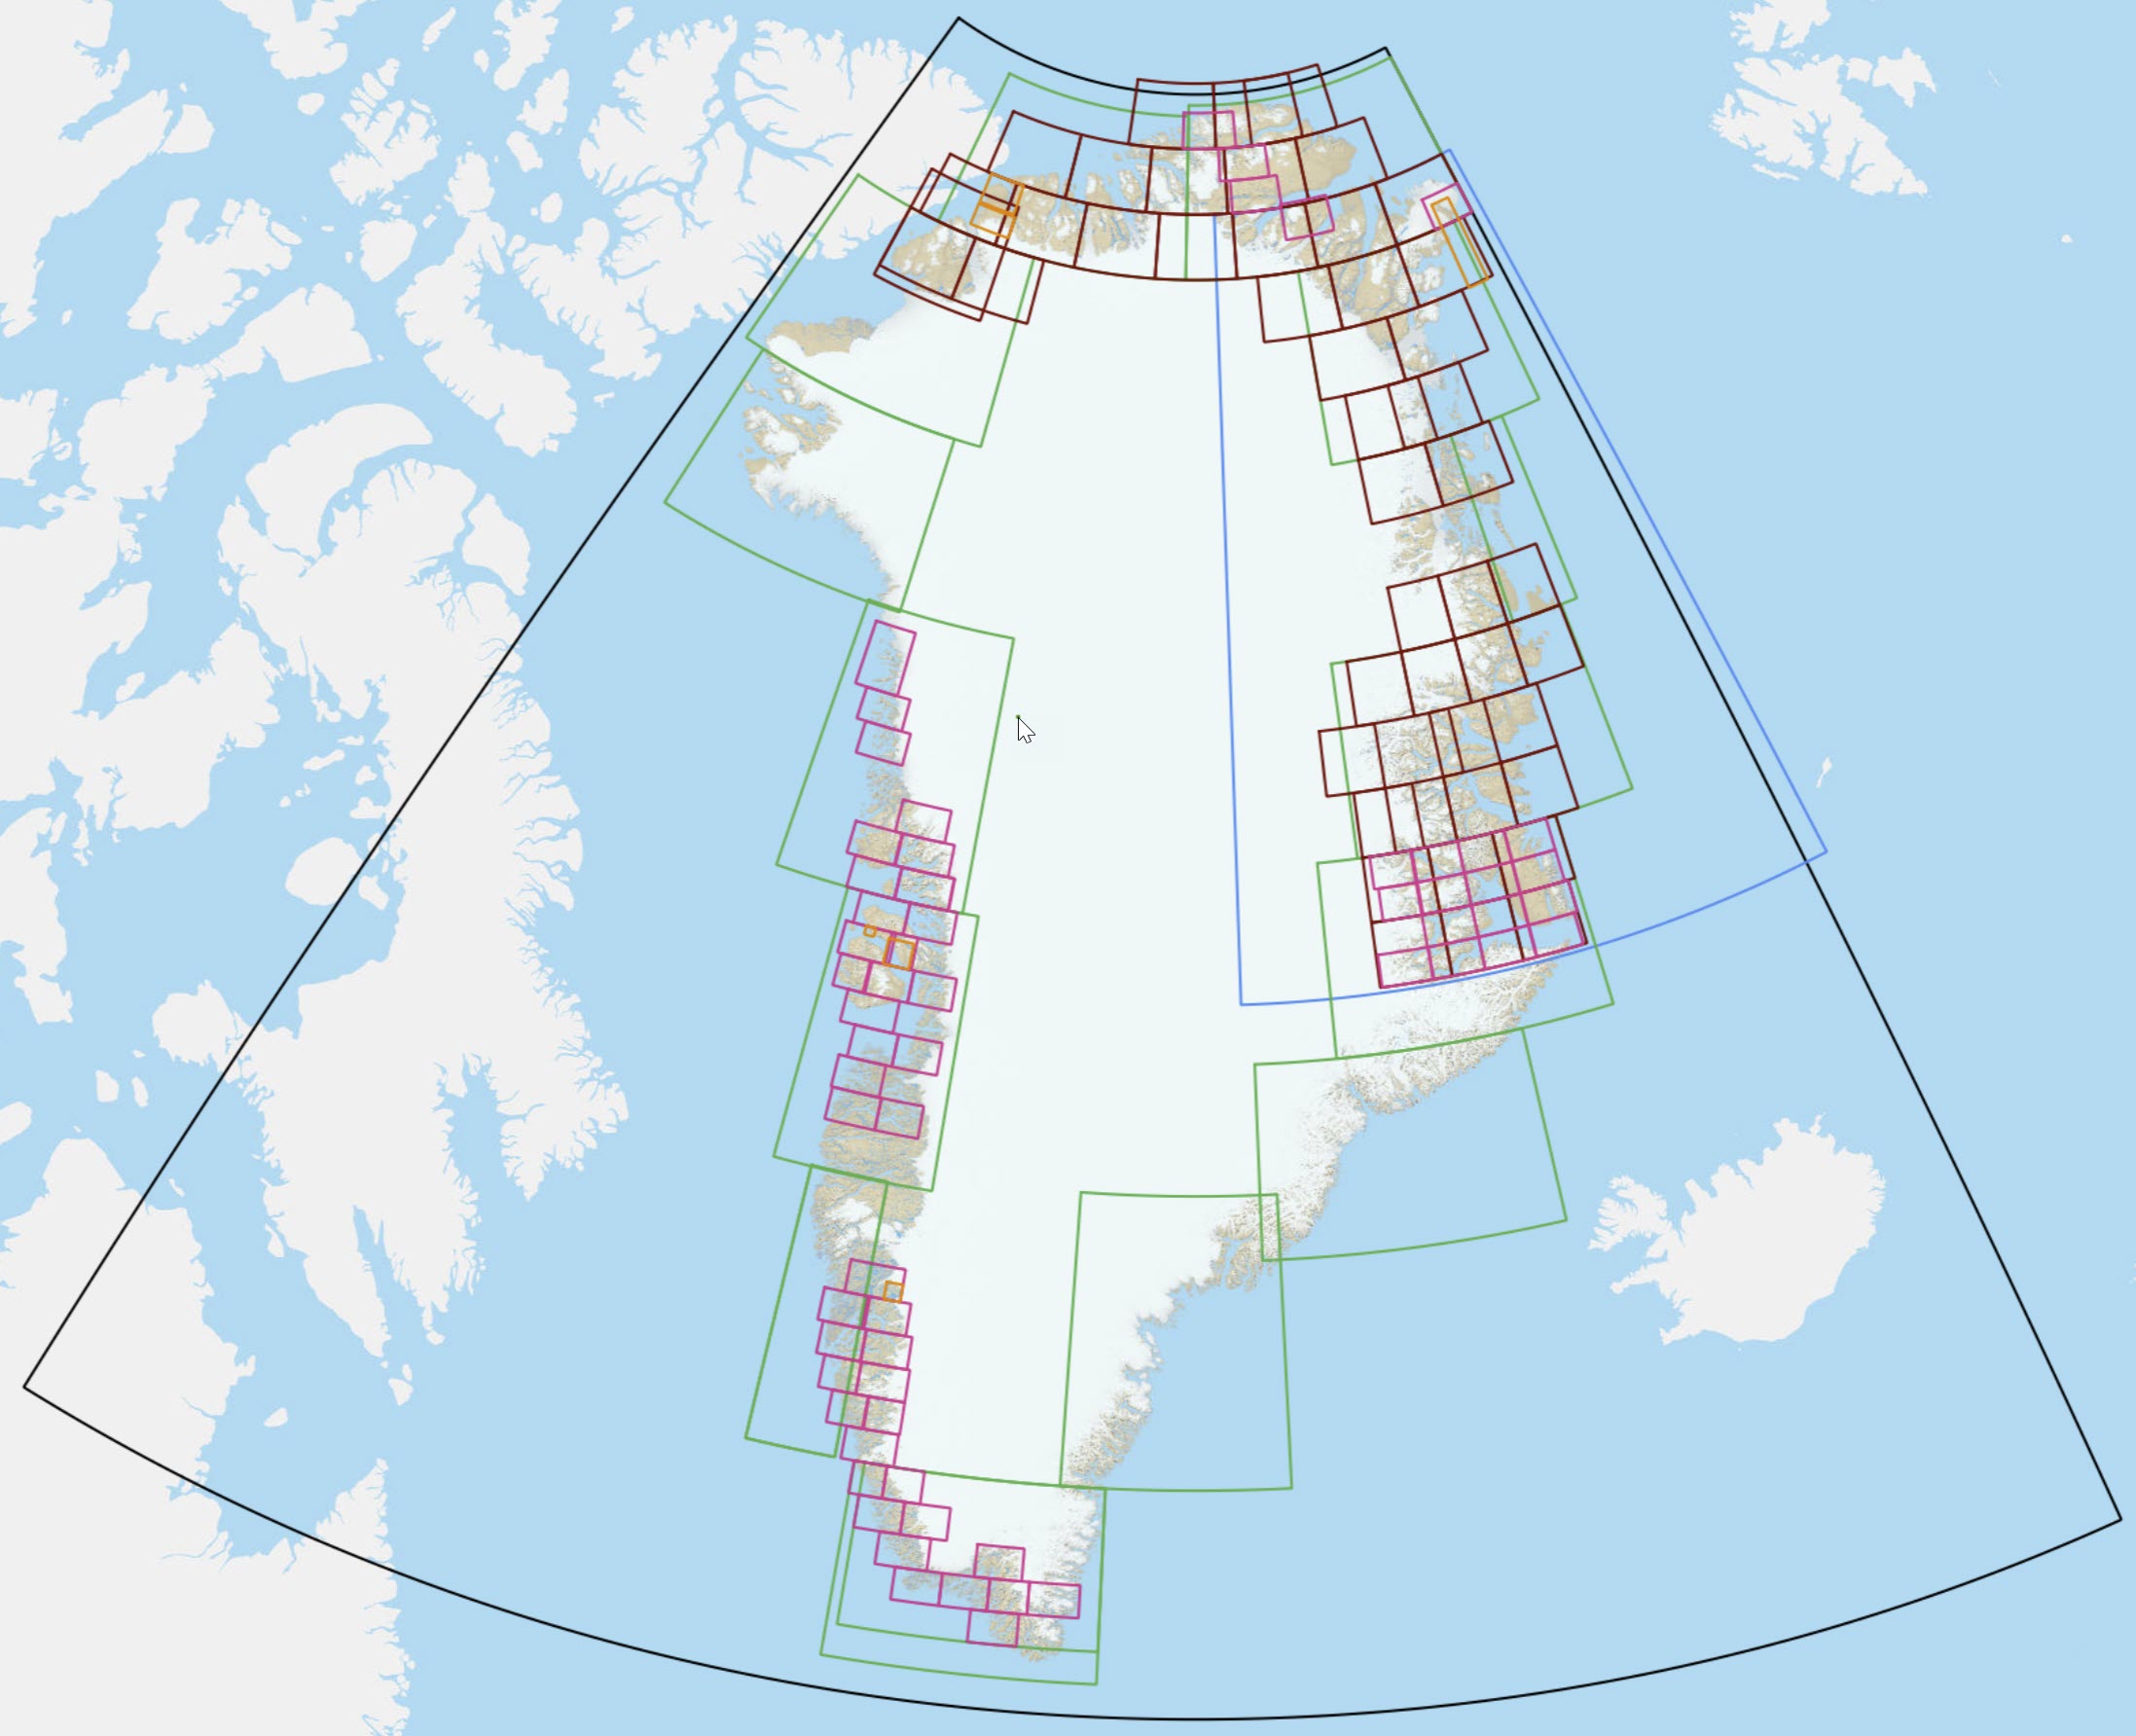
The dataset contains outlines of geological maps of Greenland printed and published by GGU and GEUS since 1957 at various scales. The dataset contains links to the GEUS Dataverse where each map has been assigned a DOI and can be downloaded in a resolution of 400dpi TIFF-images or pdf.
-
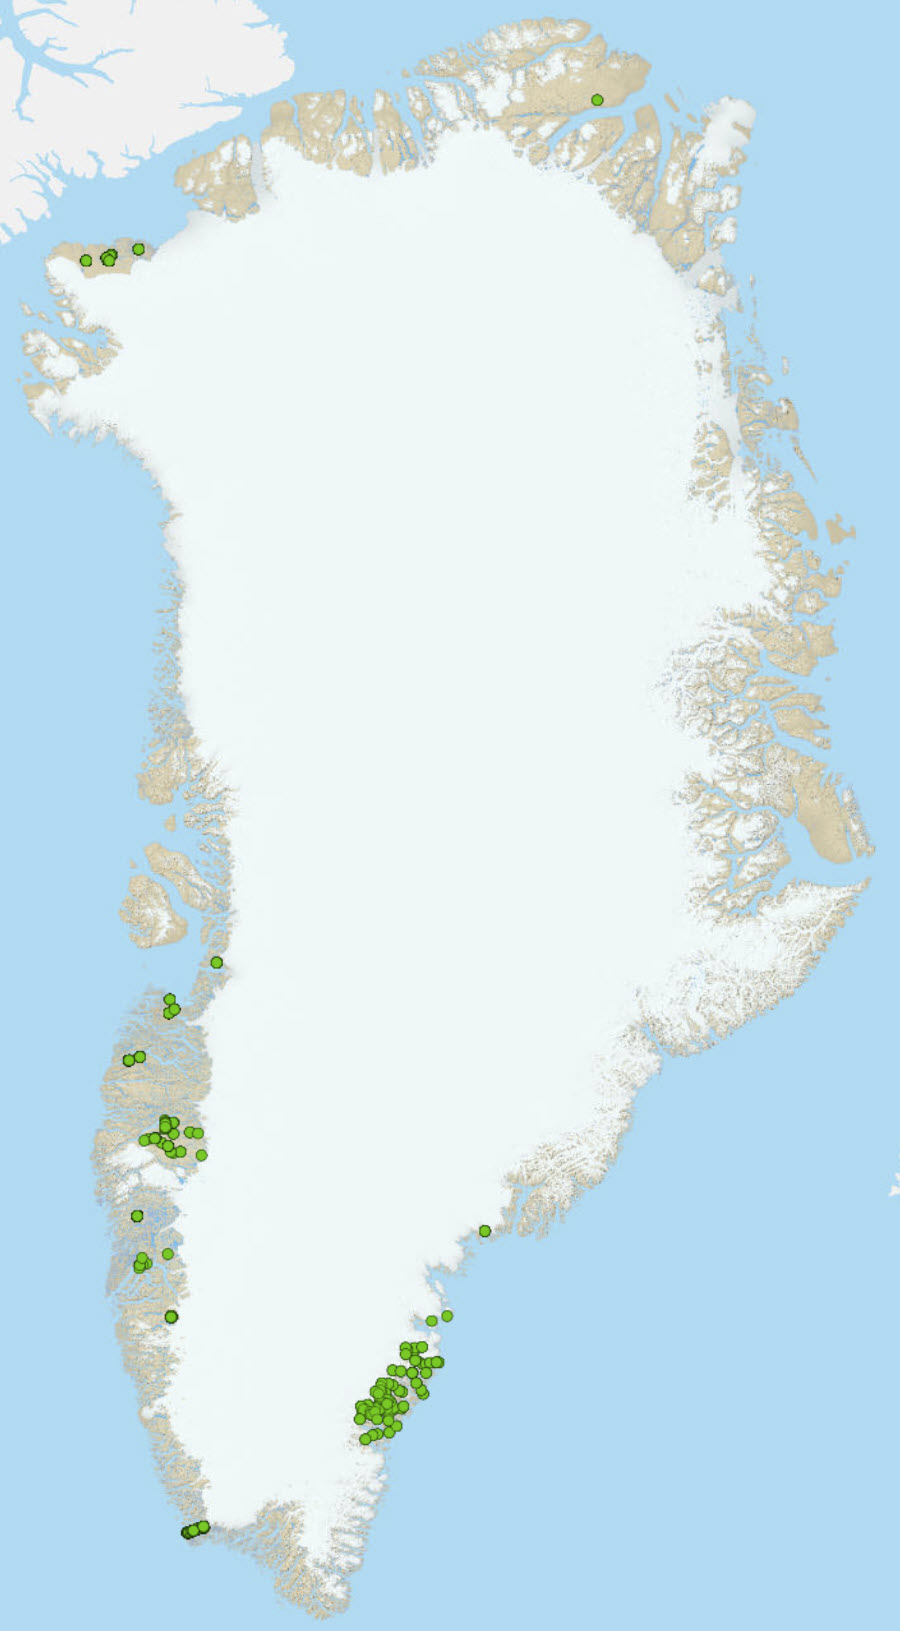
In the present database there are 1269 unique samples. Soil samples have been collected in areas without river beds. Preferably stream samples have been collected, but areas where temporarily no stream beds are present, soil samples have been collected as an alternative for geochemical mapping purpose. Five samples in this package are originally from the report Compilation of data sets for a geochemical Atlas (Steenfelt, 1999). These samples have been analysed by "UNKNOWN" methods at "UNKNOWN" laboratories. In fact these samples have been calibrated and corrected for analytical bias, see Steenfelt 1999, for further information.
-
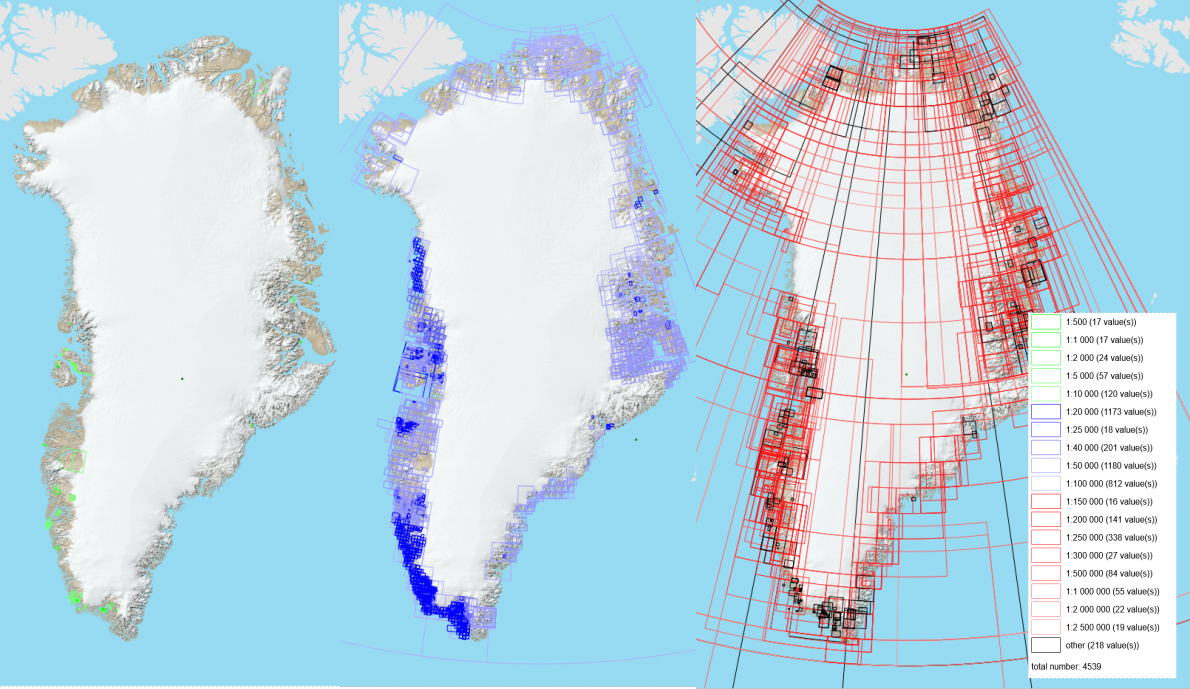
The dataset contains outlines of archived historical unpublished geological maps and sections of Greenland mostly created by GGU and GEUS but also some other institutes from 1916 onwards at various scales.
-
All active exploitation licences. The data are converted from the WFS that th ministery of mineral resources (MMR) in Greenland provides. Links are provided in the online resources